Elastic Stack (ELK)
"ELK" is the acronym for three open source projects: Elasticsearch, Logstash, and Kibana.
- Elasticsearch is a search and analytics engine.
- Logstash is a server‑side data processing pipeline that ingests data from multiple sources simultaneously, transforms it, and then sends it to a "stash" like Elasticsearch.
- Kibana lets users visualize data with charts and graphs in Elasticsearch.
What is Elastic Stack used for?
In today’s data dominated world, irrespective of the size of the organization, huge amount of data constantly flows into your systems on daily basis. As your data set grows larger, your analytics will slow up, resulting in sluggish insights. A considerable amount of this data is composed of the company’s server logs. Logs are one of the most important and often-neglected sources of information. Each log file contains invaluable pieces of information which are mostly unstructured and makes no or little sense. Without a careful and detailed analysis of this log data, an organization can remain oblivious to both opportunities as well as threats surrounding it.
Some use cases are Full Text Search, Logging, Log Analysis, Security analysis, Fraud detection, Application performance monitoring and so on.
1) Enable and Run ELK
Change directory to your solution folder in terminal and run docker-compose up elk
Elastic Search, Logstash and Kibana will be running in your Docker instance.
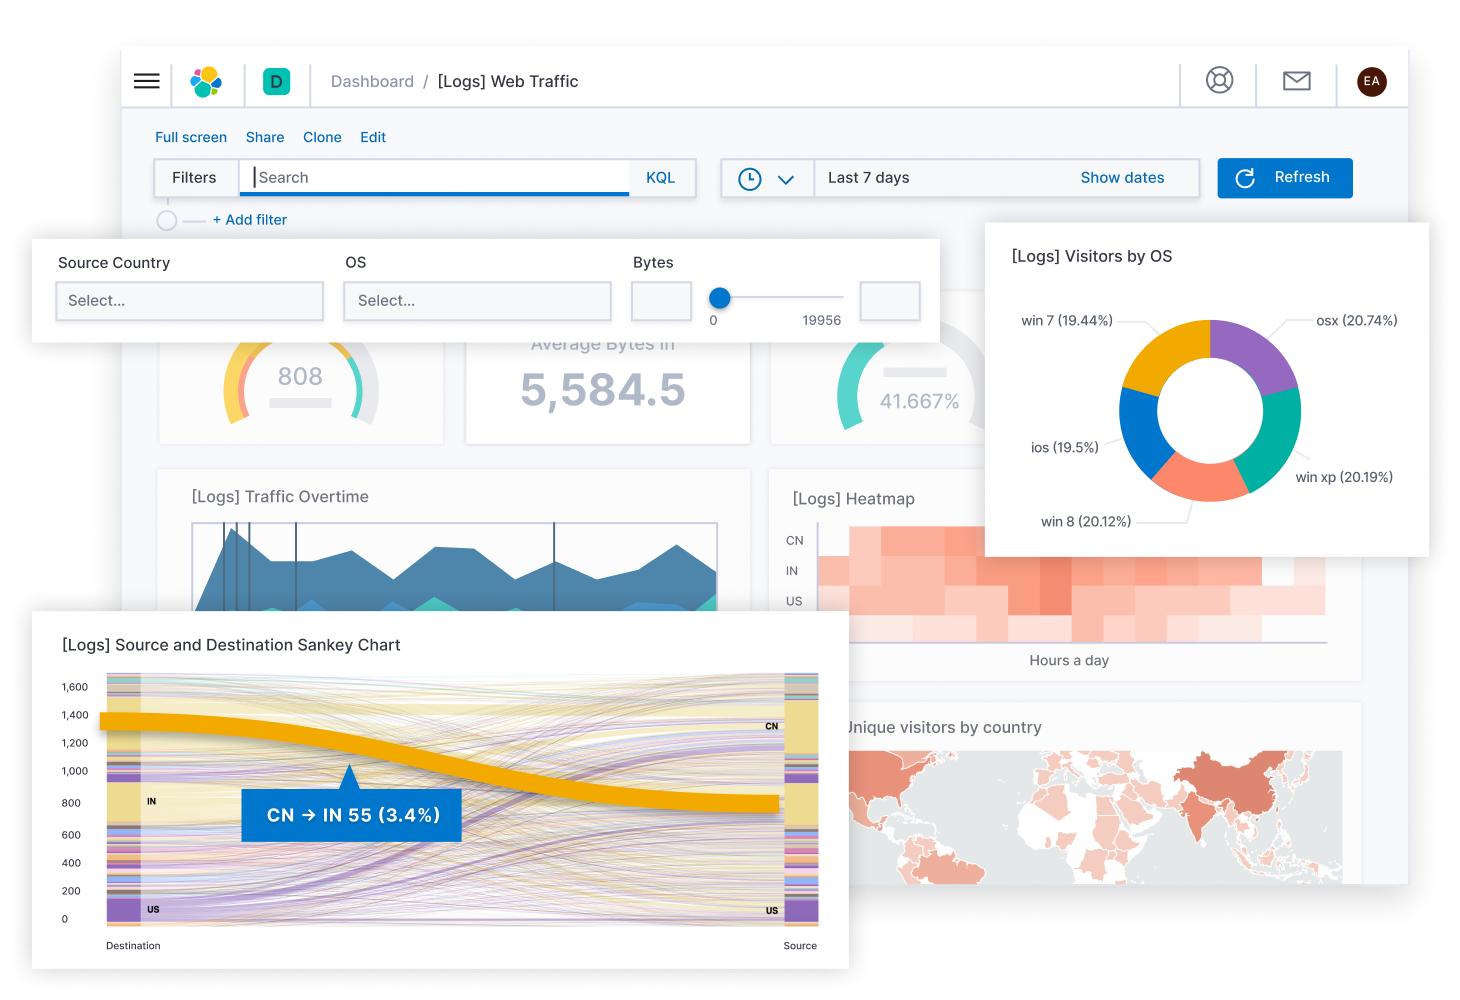
2) Kibana Dashboard
In Management / Search & Monitor page you'll view Kibana Dashboard.
Sample Dashboard
Please visit Elastic Stack official web site